




Oil and gas feasibility analysis skills in Nigeria include explaining how assumptions affect a recommendation. A tidy total is useful only when a reader can see its inputs, units and limits. This fictional exercise shows why the planning horizon can change which of two options has the lower displayed cost.
The worked model uses invented units, not naira, market prices or ministry project data. It supplies three charts, a claim-type infographic, an editable calculator and four CSV tools. It does not approve infrastructure, demonstrate technical competence or provide an investment appraisal.
What the ministry programme actually reports
A Ministry of Petroleum Resources release dated 12 November 2026 describes a three-day programme that began on 11 November. It brought together ministry engineers, geologists and other relevant professionals. Assessment templates, measurement and metering, and technical evaluation feature in its agenda.
However, the release provides no attendee total, assessment results, hiring measure or measured efficiency gain. The agenda establishes planned subject matter. It cannot establish that every participant completed the programme or acquired a particular skill. Three days is a programme duration, not a competence threshold.
Define the comparison before entering numbers
Our narrow question is: which fictional option has the lower undiscounted total over a selected horizon? Both options have an upfront amount and a constant annual operating amount. We assume the recurring amount applies for every full year. We do not model revenue or assign a monetary value to service quality.
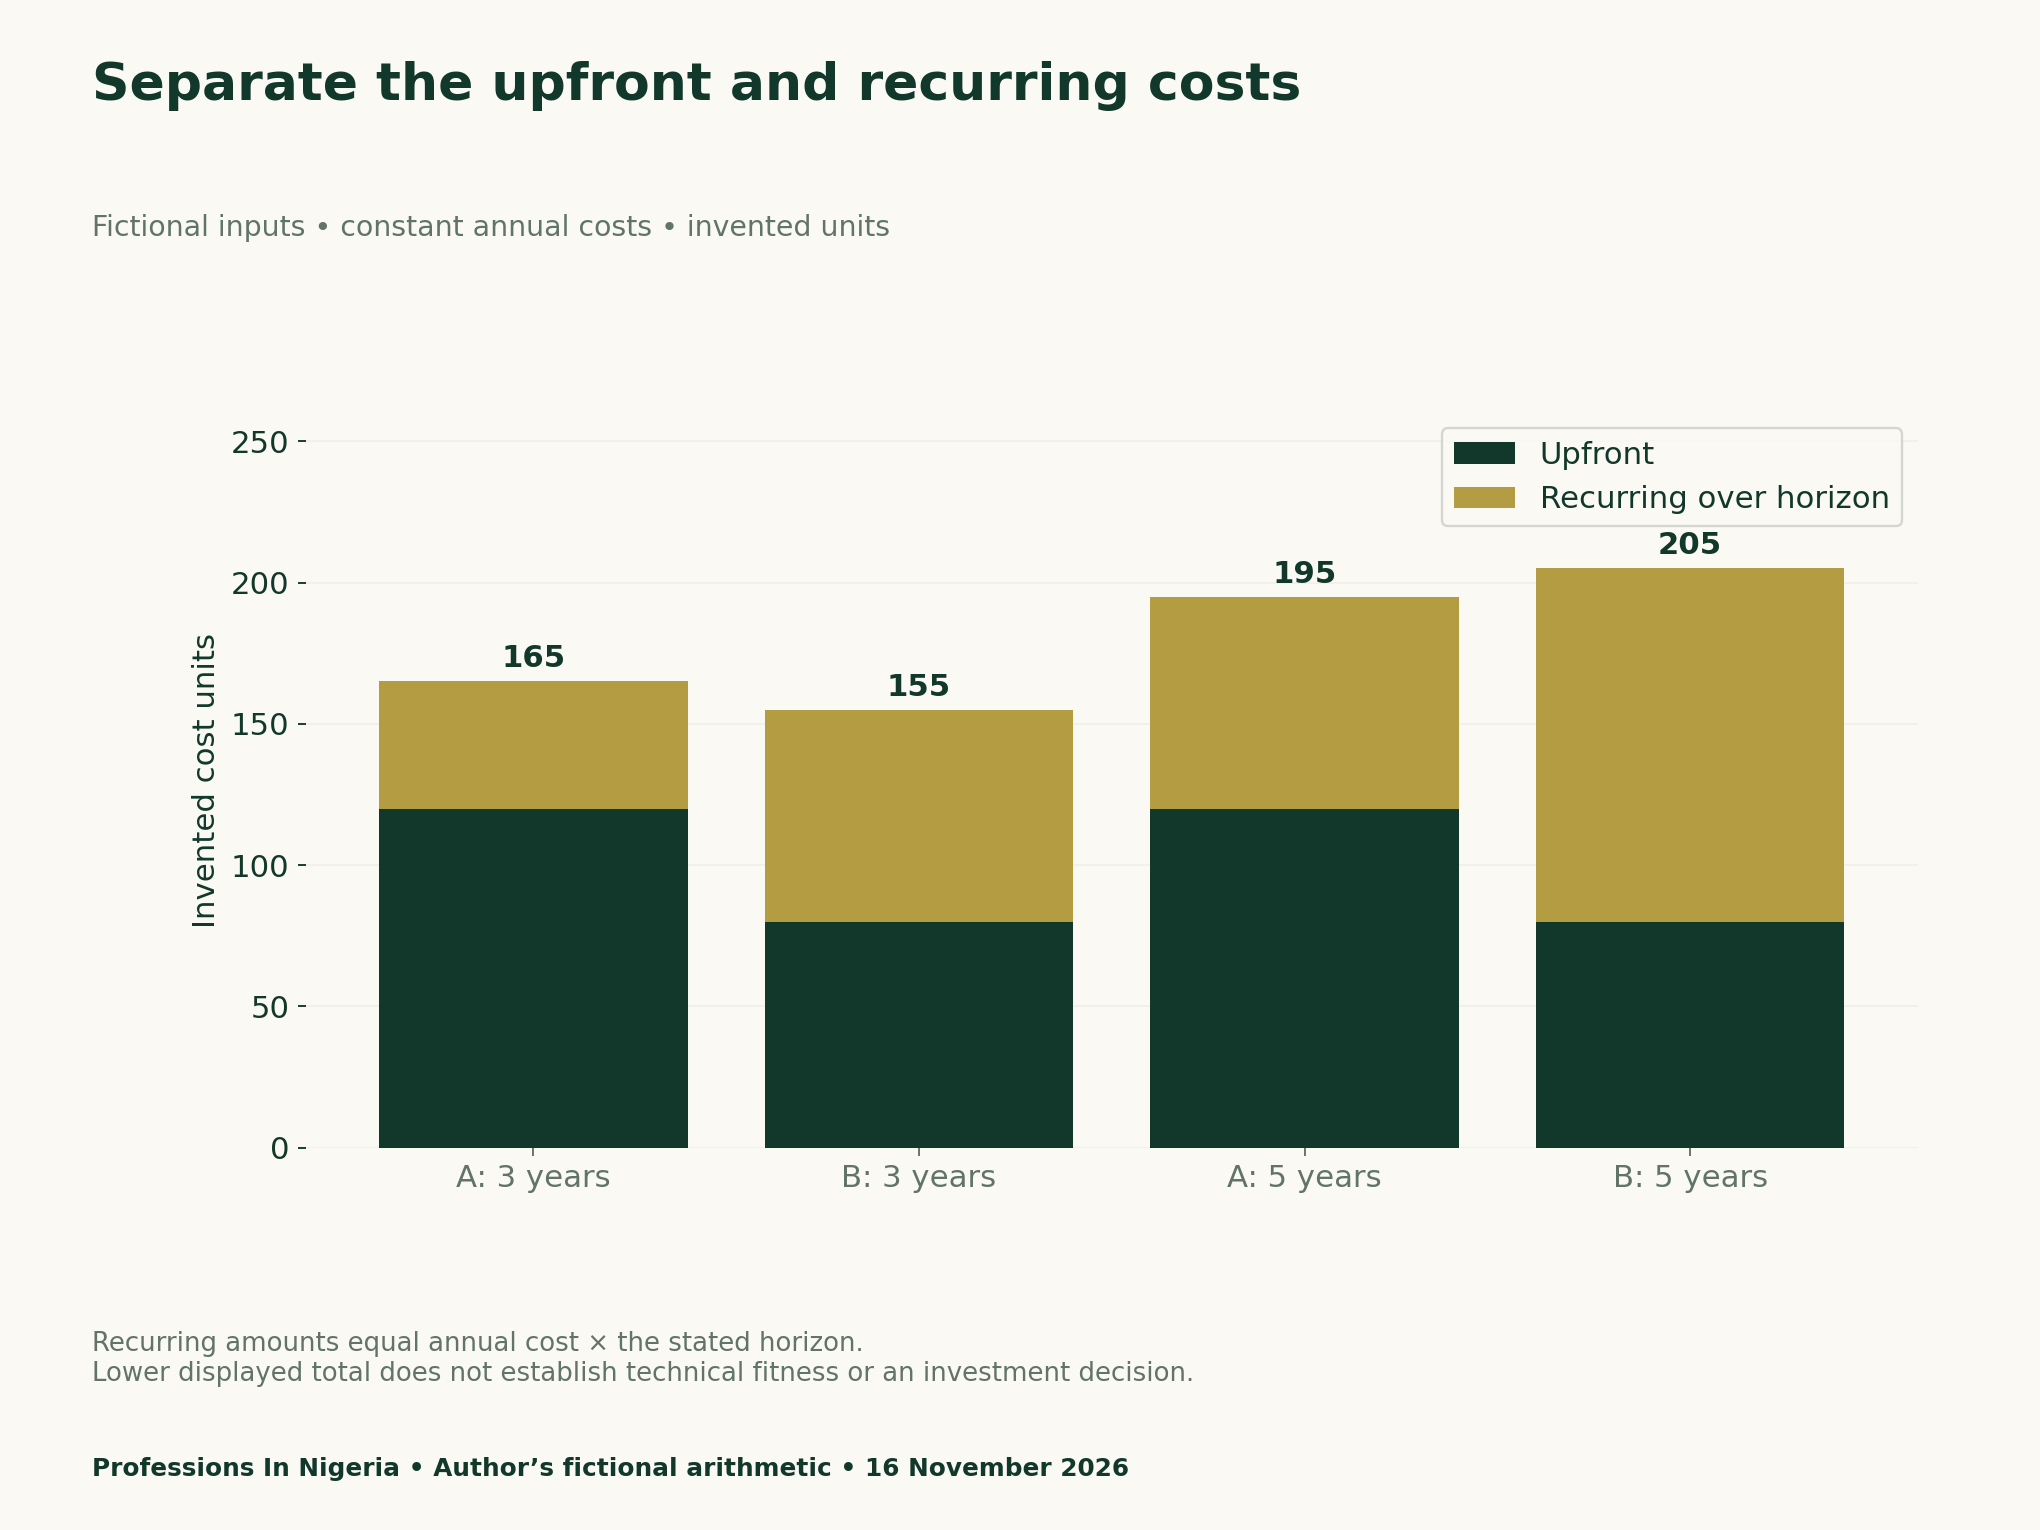
| Fictional input | Option A | Option B |
|---|---|---|
| Upfront cost, invented units | 120 | 80 |
| Annual cost, invented units per year | 15 | 25 |
First, record the unit beside each input. An upfront stock amount and an annual flow cannot simply be added without a period. Then state the horizon. Finally, identify omitted matters before presenting a result as a recommendation.
See the four-year crossover
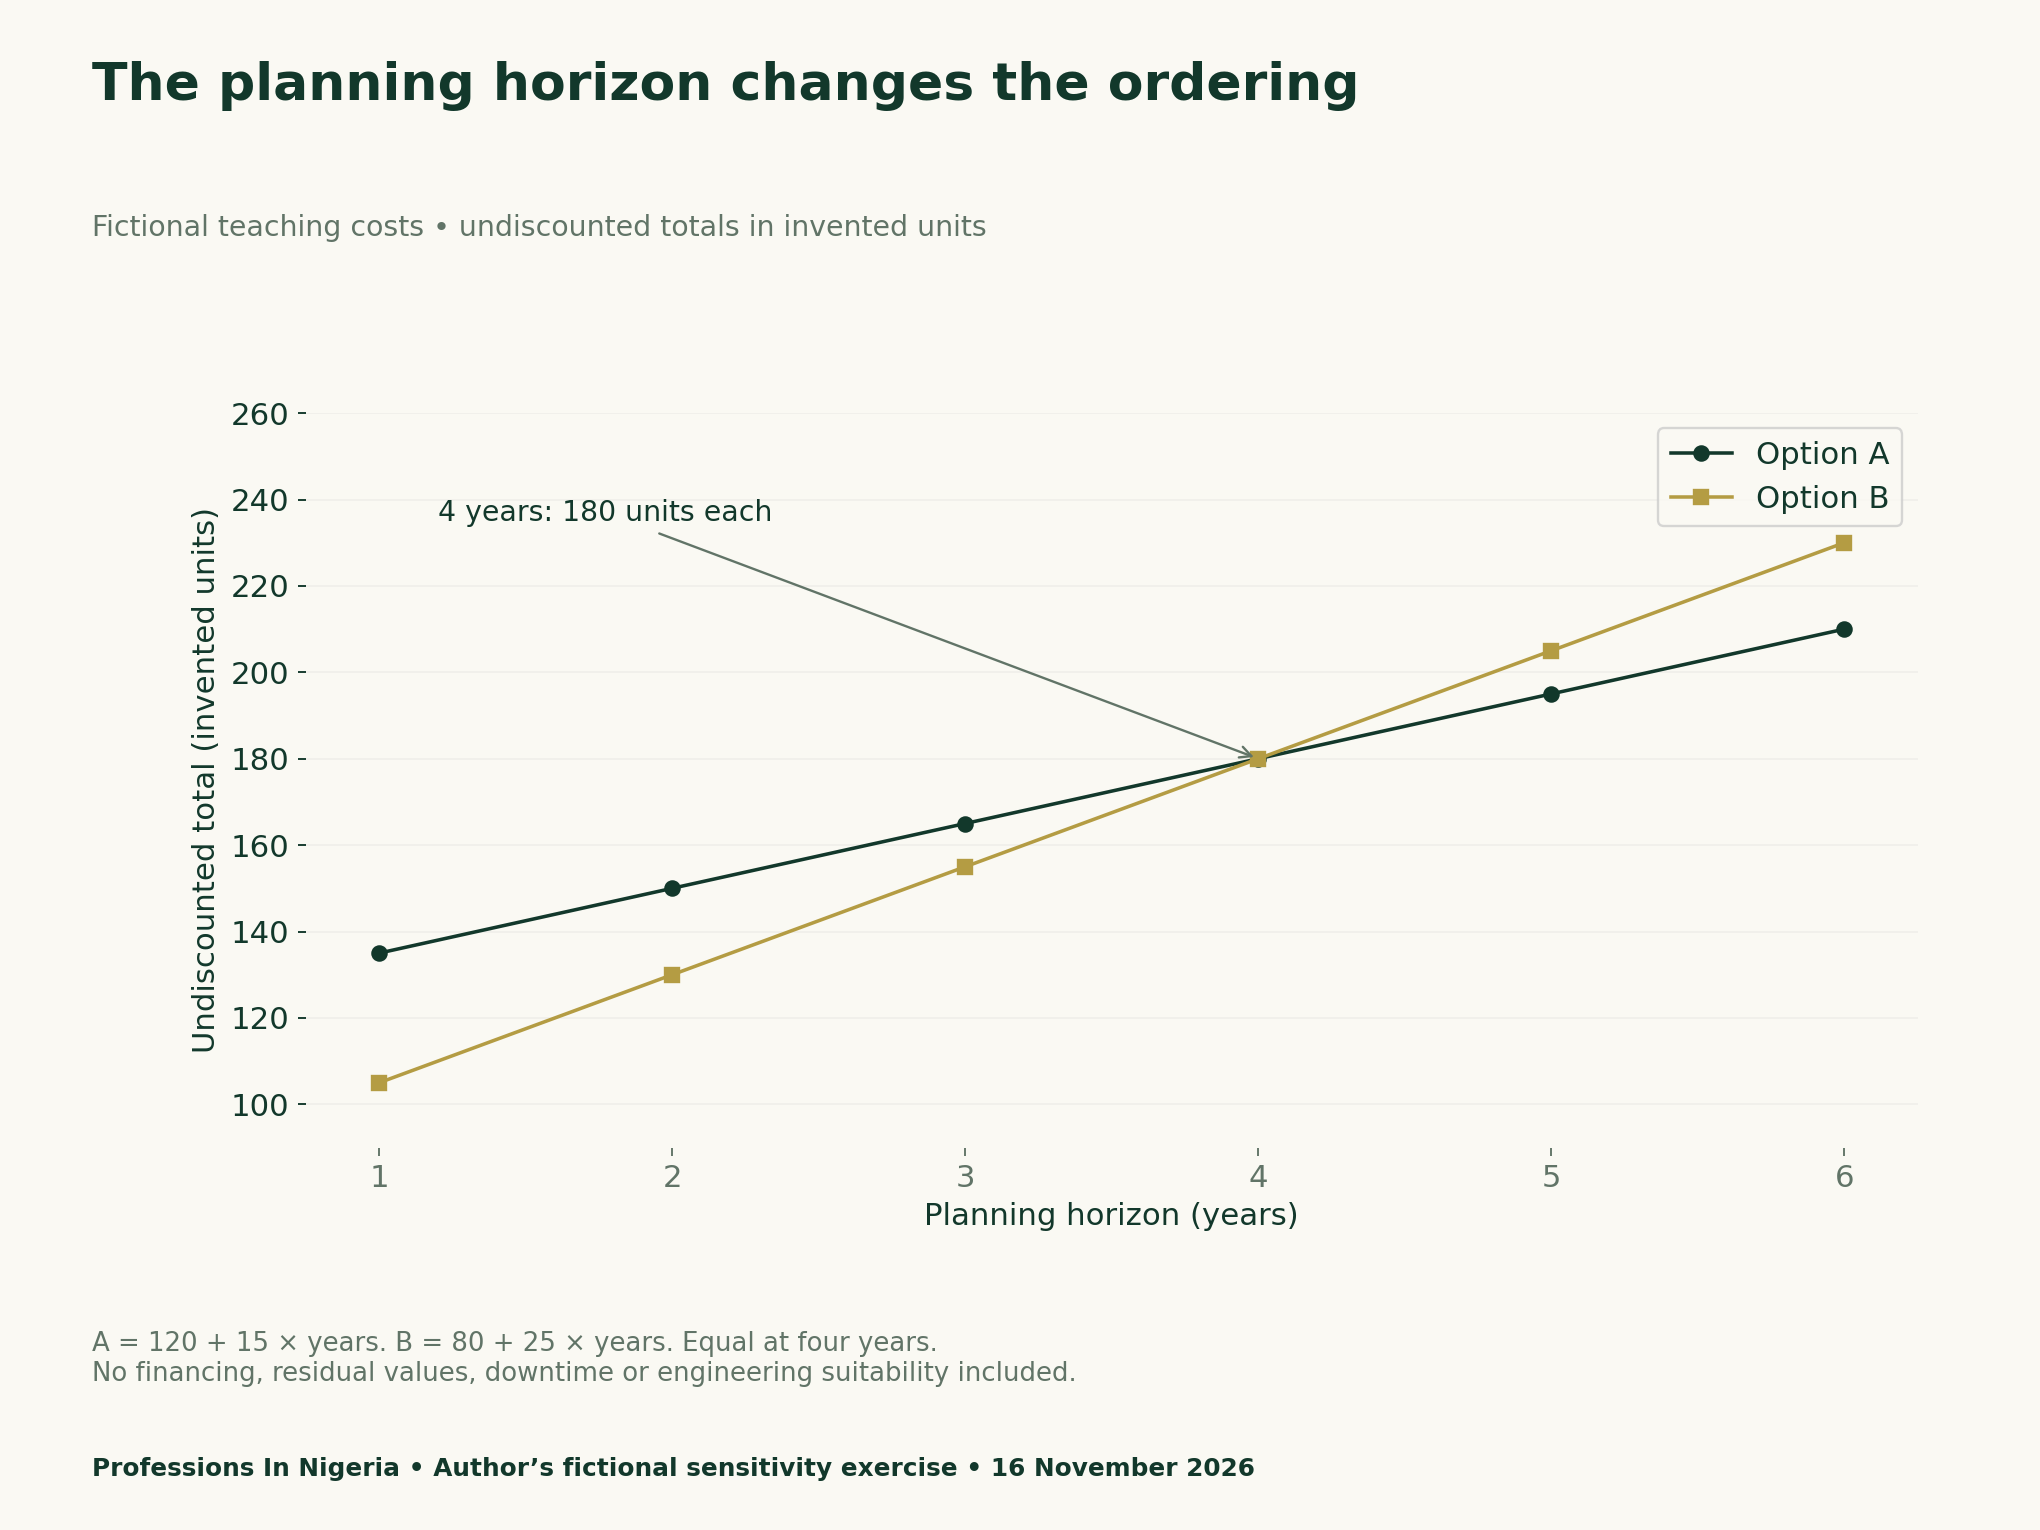
At three years, A costs 120 + 15 × 3 = 165 units. B costs 80 + 25 × 3 = 155 units. Therefore, B has the lower displayed total by 10 units. At five years, A totals 195 and B totals 205, so the ordering reverses.
To find the tie, set 120 + 15h equal to 80 + 25h. Rearranging gives 40 = 10h, hence h = four years. Both totals then equal 180. This equality depends on every stated assumption, including the constant annual amounts.
Try the editable teaching calculator
Change the horizon or B’s annual amount below. The fixed A inputs remain 120 upfront and 15 annually; B remains 80 upfront. Blank, negative and non-finite inputs produce no result. Zero years is a valid upfront-only comparison. The output names a lower displayed cost, never an approved option.
Fictional cost comparison
At 3 years: A = 165 units; B = 155 units. B has the lower displayed total.
Invented units. Undiscounted totals. No technical suitability, financing, residual values or downtime assessment.
Vary a second assumption
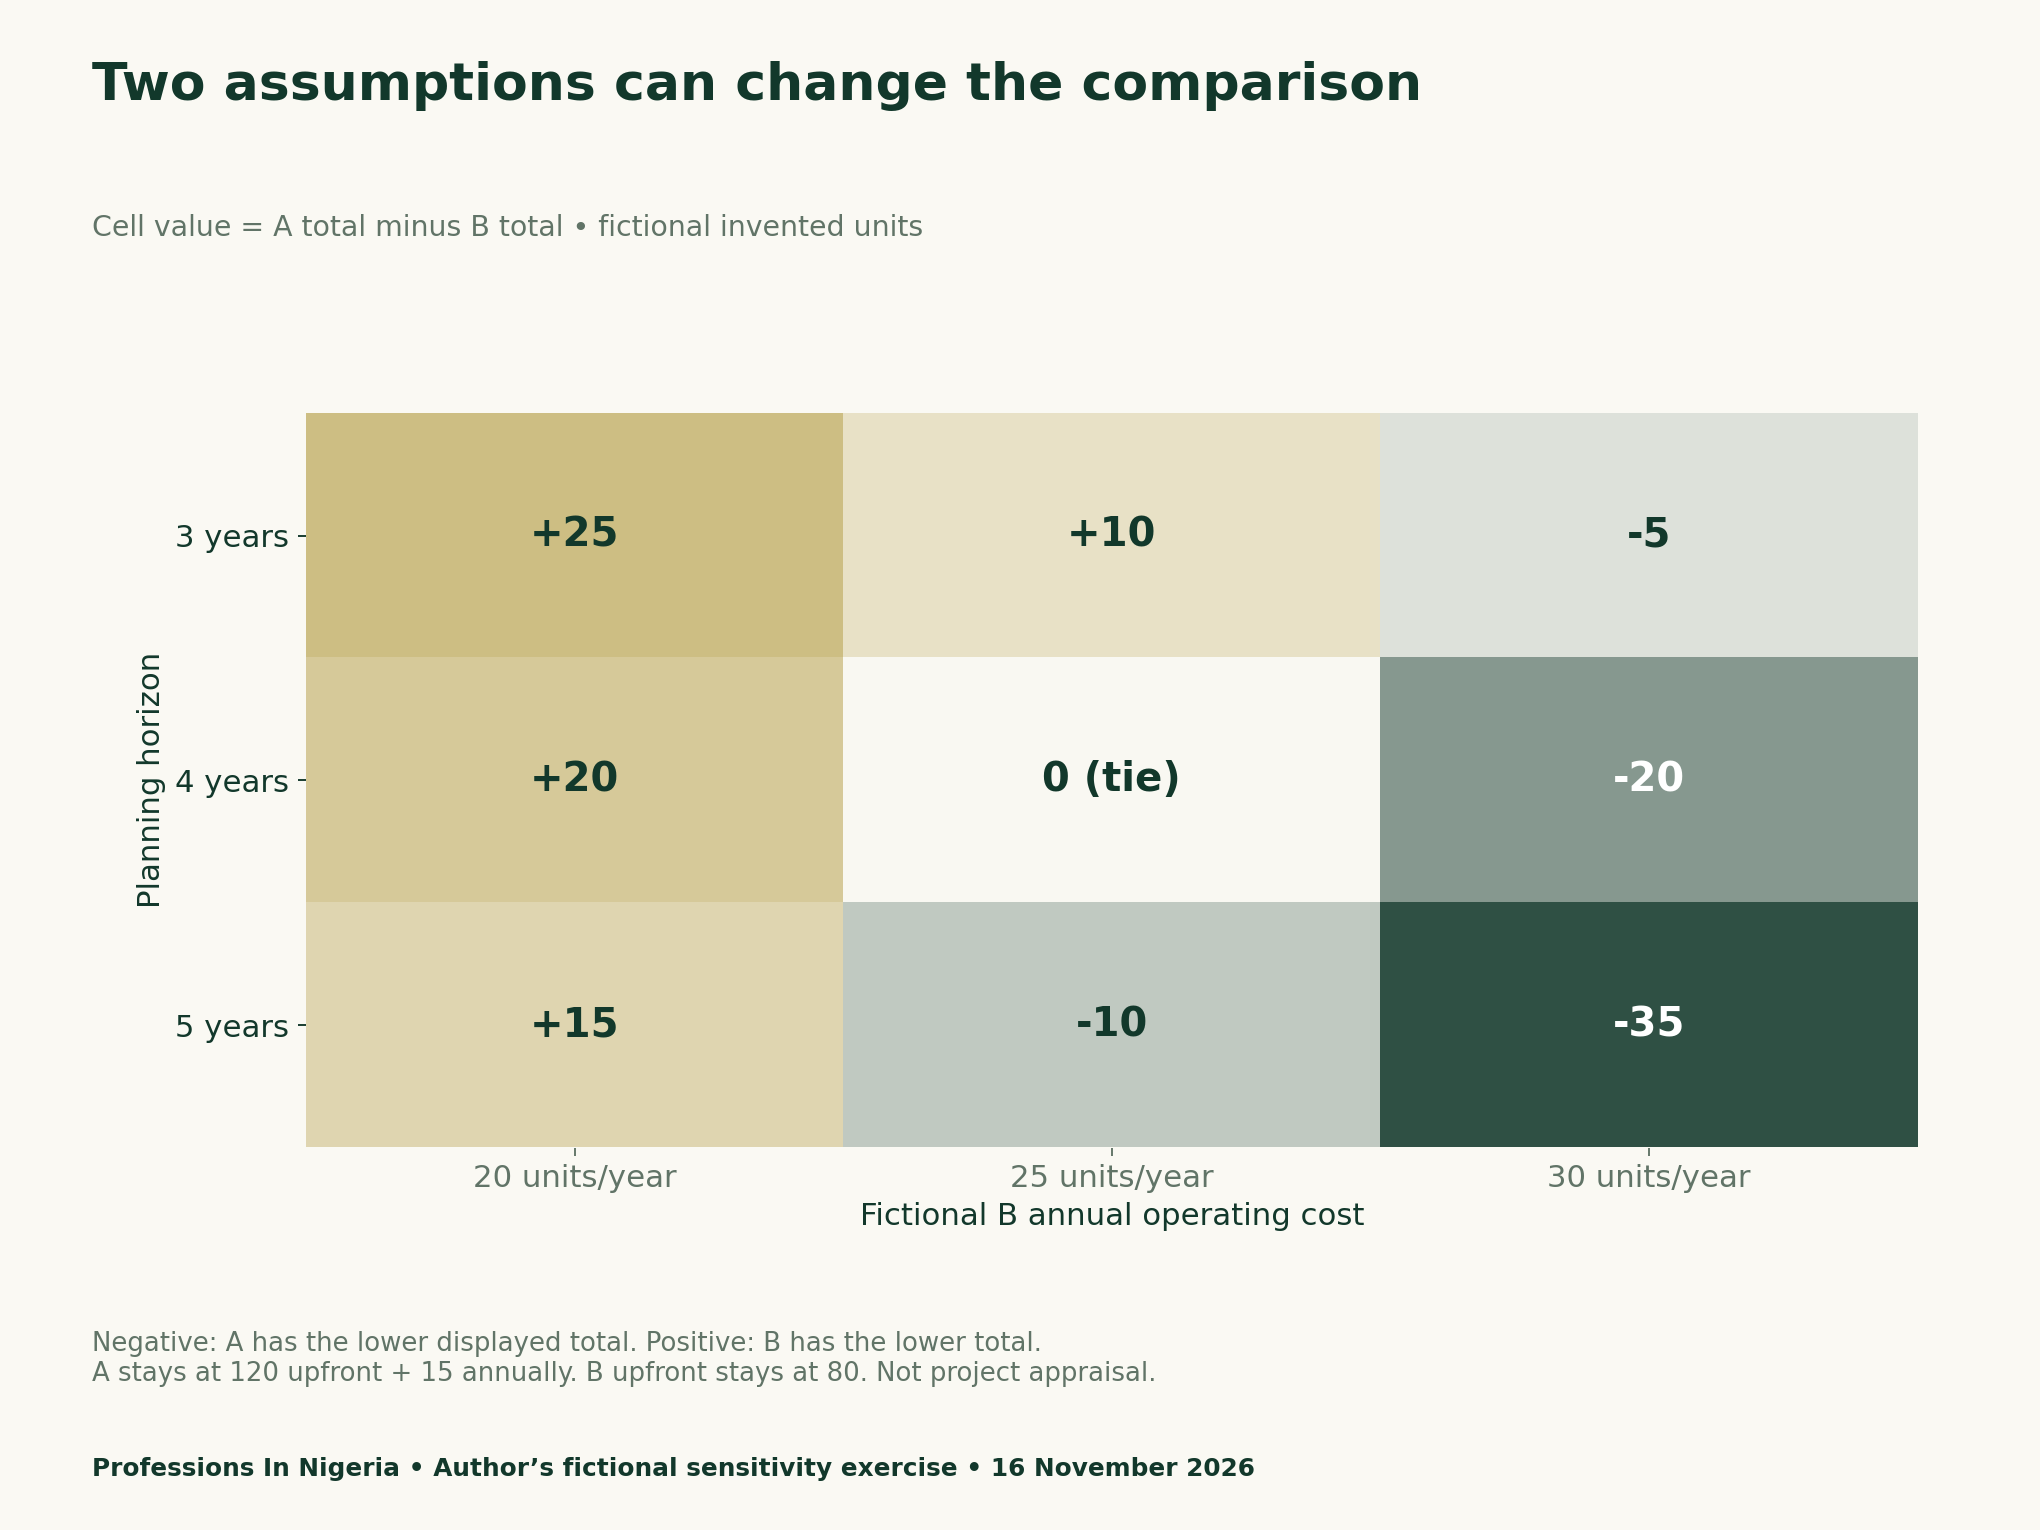
For example, at three years and B annual cost of 20, A totals 165 and B totals 140. At the same horizon with B annual cost of 30, B totals 170, making A lower by five. Thus, a horizon alone does not determine the ordering when operating costs also change.
A sensitivity table answers “what if?” It does not say which input is likely. To discuss likelihood, you would need justified evidence about the actual setting and an appropriate uncertainty method. We have neither in this invented example, so we do not attach probabilities.
Separate observation, assumption, calculation and judgement
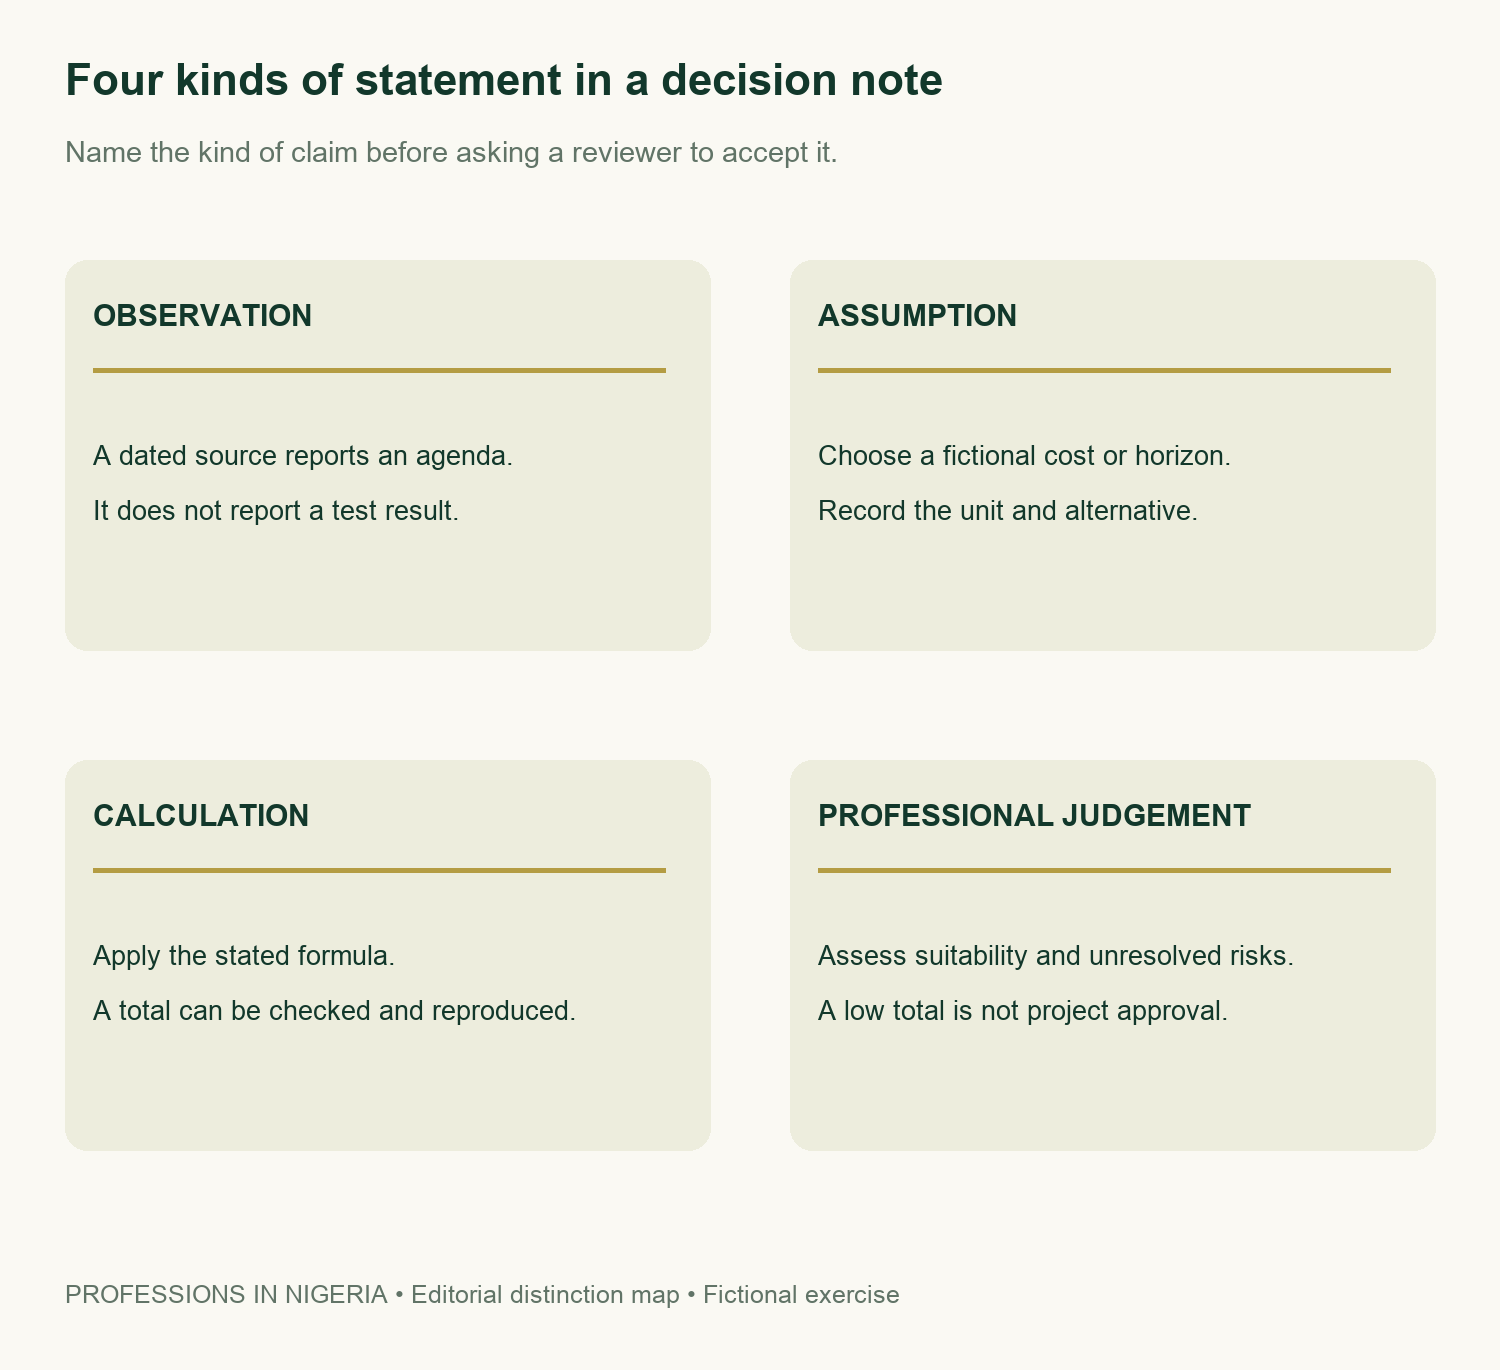
An assumptions register makes the distinction practical. Enter the value, unit, source, confidence or limitation, alternative value and reviewer. If the input is fictional, say so. If evidence is missing, leave the finding unresolved rather than entering a reassuring zero.
Also keep missing considerations in view. Financing, discounting, residual value, downtime, uncertainty and engineering suitability could change a real comparison. Environmental, operational and other applicable constraints would need their own qualified assessment. This article gives no pipeline, calibration or fiscal-measurement instructions.
Write a bounded decision note for a mentor
Start with the question and the evidence you actually have. Next, name the assumptions and show the calculation. Explain one alternative that reverses the ordering. Then list unresolved matters and identify the appropriate qualified reviewer for each. This gives a mentor something specific to challenge.
For this exercise, the defensible statement is limited: under the fictional constant-cost assumptions, B has the lower three-year total and A the lower five-year total. It is not a statement that either option should be built, bought or operated. No live project or confidential drawing belongs in this public exercise.
For another example of keeping units distinct, see our public-works duration report. Both exercises make the evidence boundary visible before discussing professional implications.
Download the model tables and decision tools
- Fictional horizon inputs and calculated totals (CSV)
- Two-input fictional sensitivity matrix (CSV)
- Assumptions register with fictional starting inputs (CSV)
- Blank bounded decision-note template (CSV)
You can open the CSVs in a spreadsheet to inspect the inputs and outputs. The downloaded tables contain the displayed values; the editable calculator above performs recalculation. For more dated analyses, browse Research & Reports.
Methodology and limits
We checked the official programme release on 16 November 2026. All costs, alternatives and model results in this article are original fictional teaching calculations. We independently reproduced the three-, four- and five-year totals and the nine matrix cells. No industry cost dataset, participant assessment or employment survey underlies them.
Three charts explain different parts of one small model: the horizon crossover, cost components and two-input sensitivity. The infographic explains claim types. The tools support a bounded learning discussion; they do not constitute professional validation, investment advice or project approval.


