







For women in the civil service, career progression in Nigeria needs data with clear denominators. A workforce representation share tells you who is in a stated group. A promotion rate asks a different question about people eligible for a defined process. Confusing the two can turn a useful snapshot into an unsupported prediction about an individual’s future.
This guide explains three preliminary federal percentages, shows the percentage-point arithmetic and provides blank monitoring and mentoring tools. It does not estimate your promotion chances, diagnose a cause of the pattern or claim that a new partnership guarantees advancement.
Career progression data for women in the civil service in Nigeria
OHCSF published its statement on October 27, 2026, reporting a meeting and signed statement dated October 26. Its preliminary analysis gives women’s shares as 43.84% overall, 42.31% at Grade Levels 15–17 and 40.11% at Grade Level 17. The workforce snapshot date and underlying counts are not published in that account.
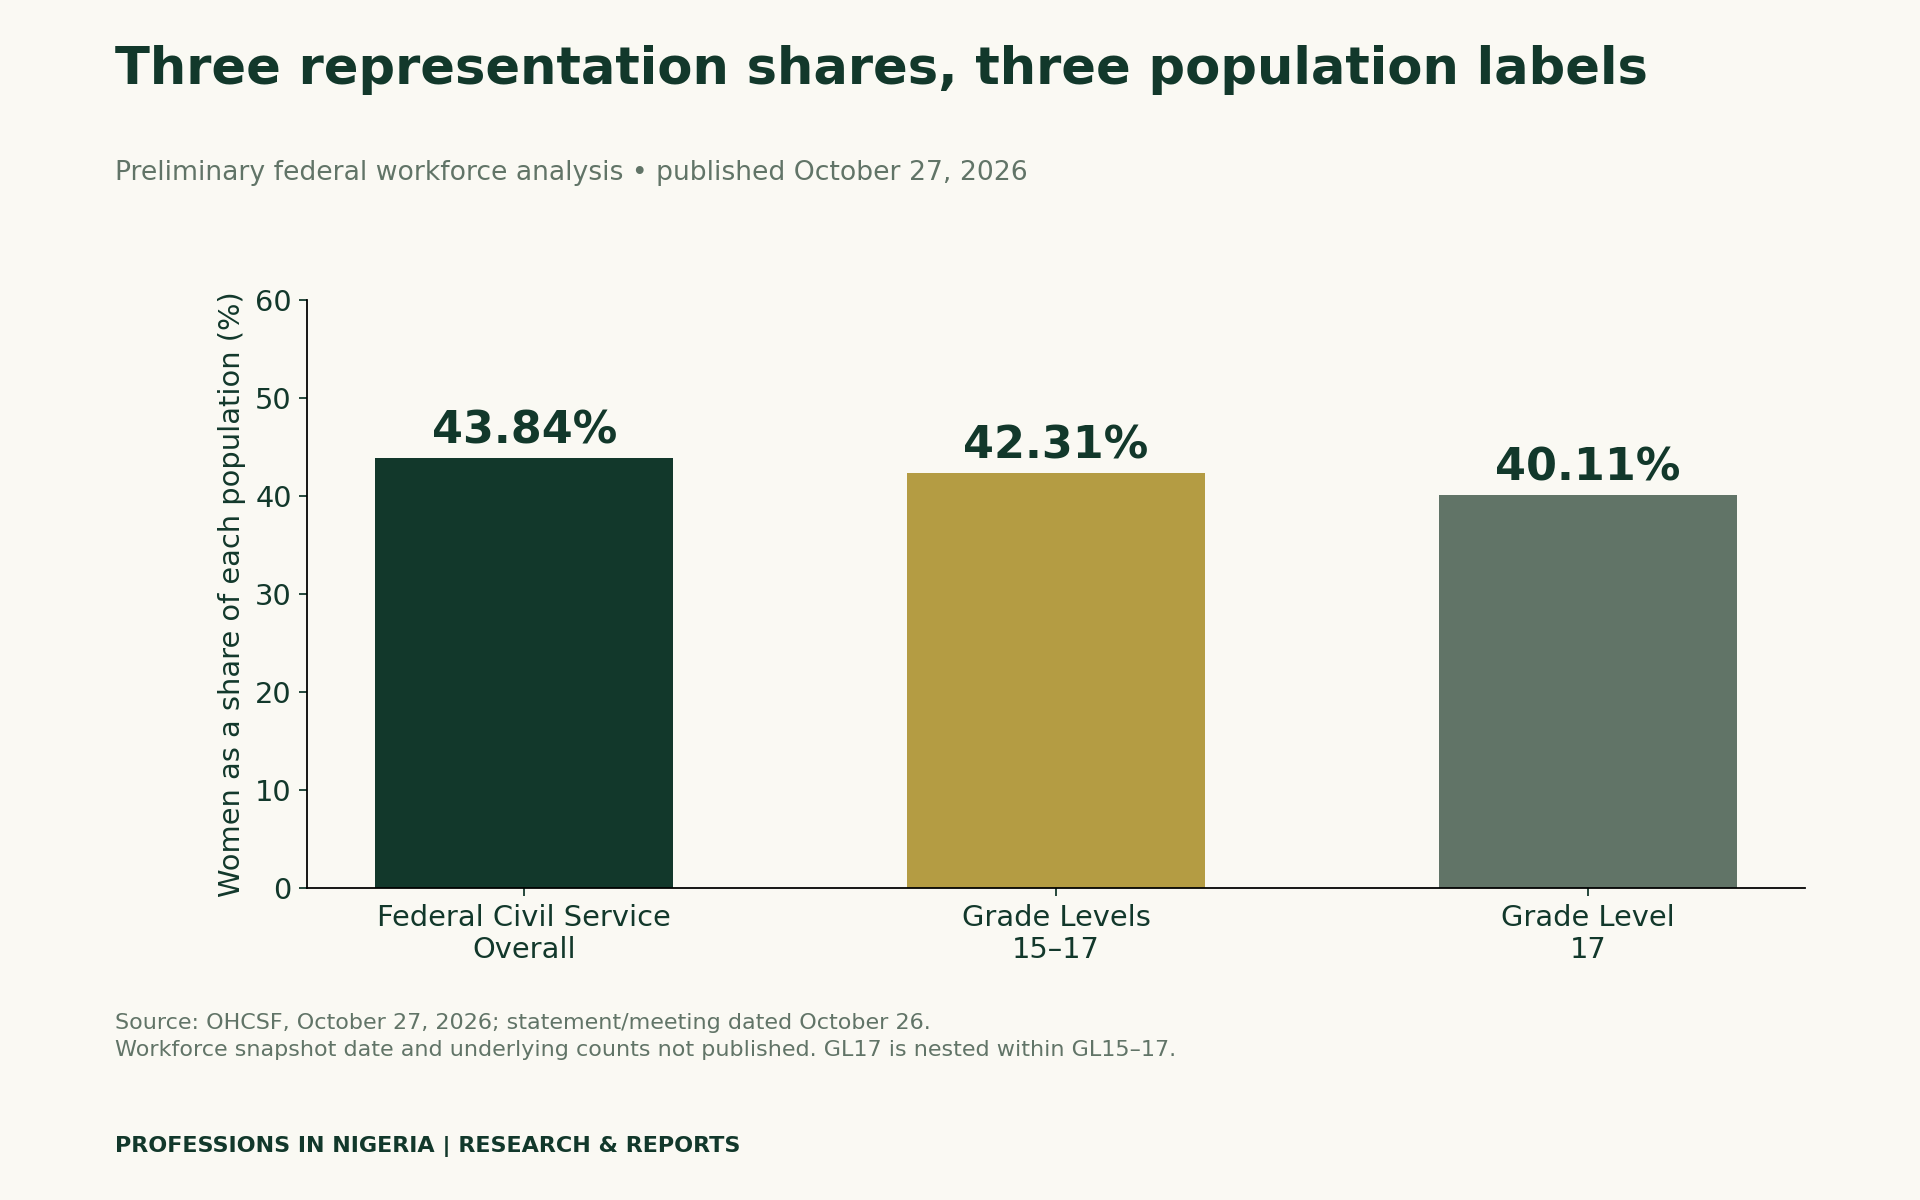
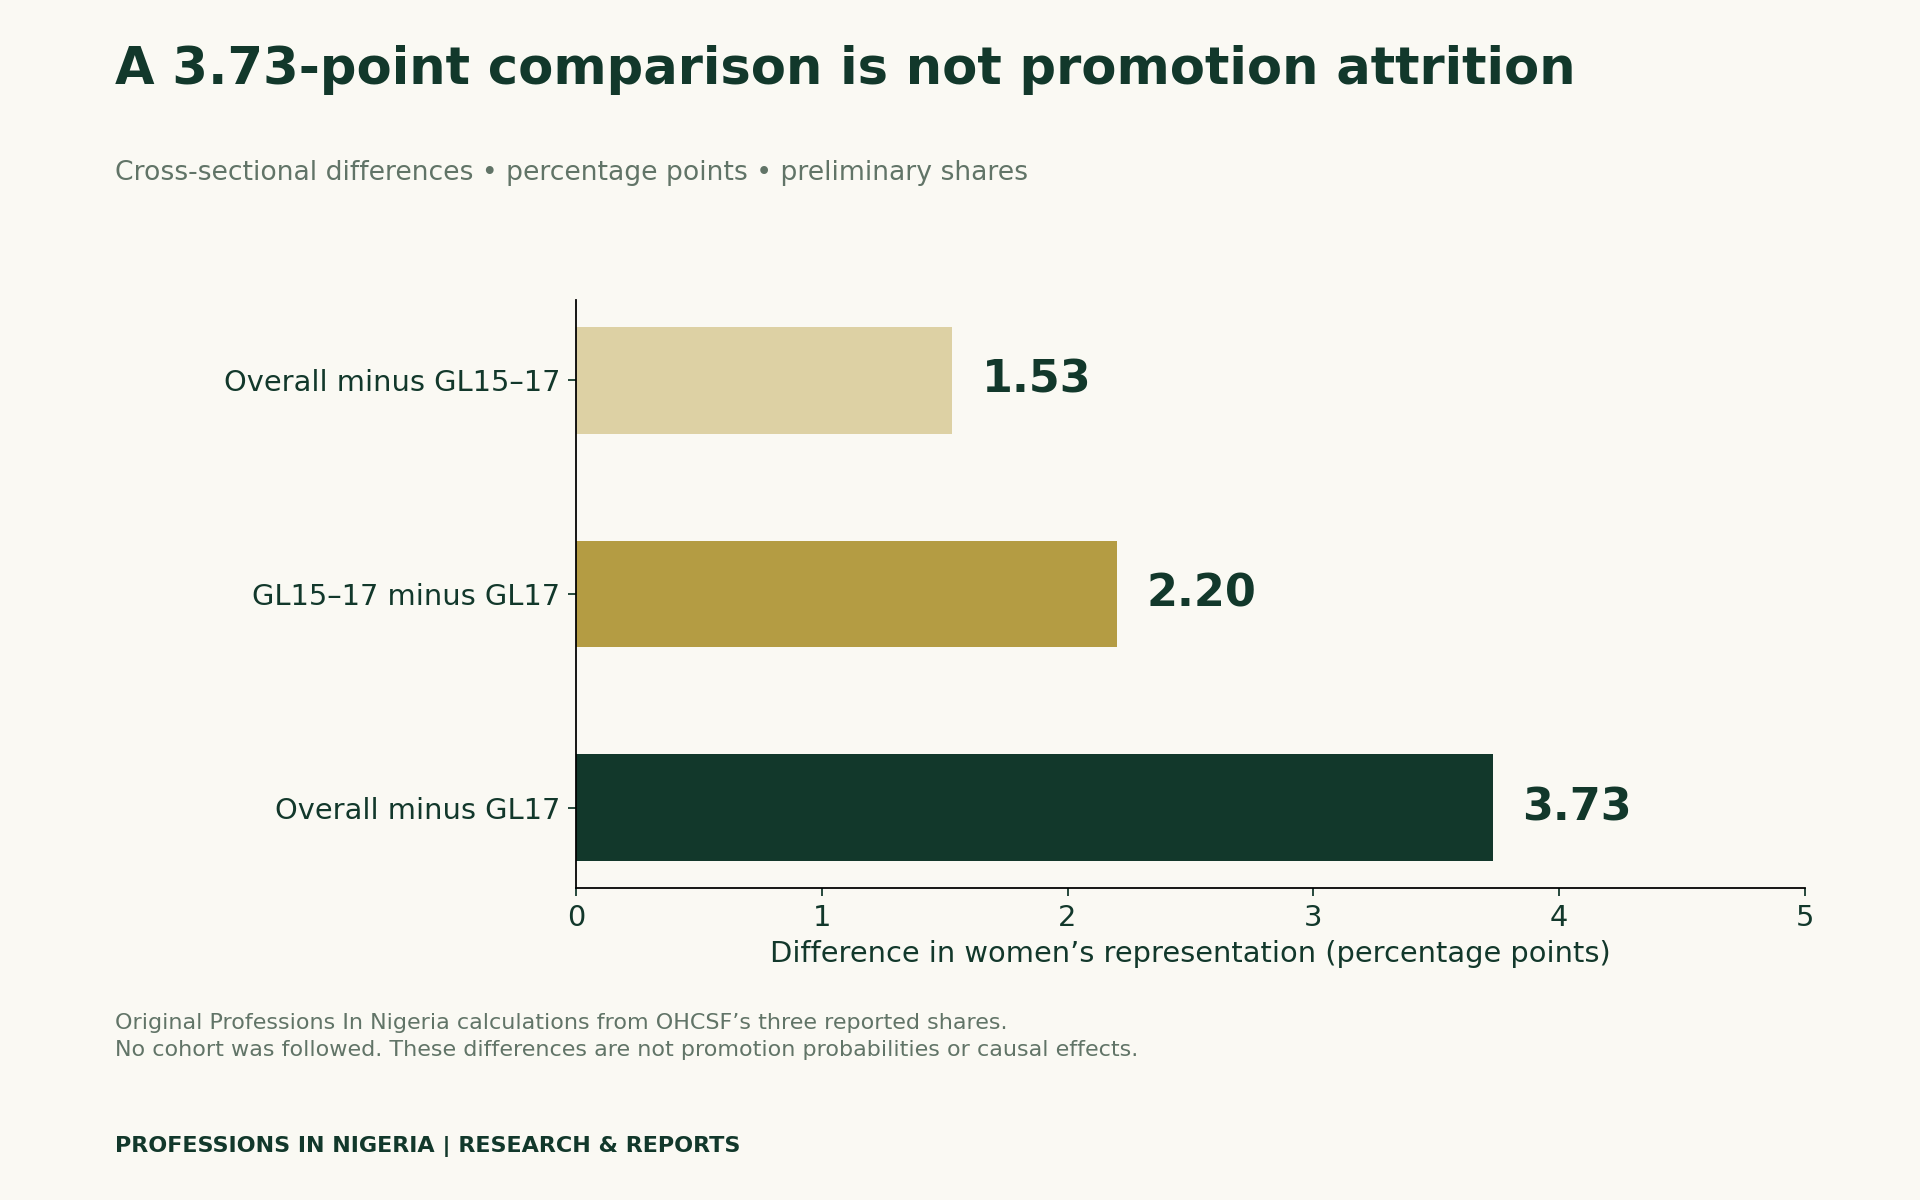
The overall-to-GL17 comparison is 43.84 minus 40.11, or 3.73 percentage points. It is a difference between cross-sectional representation shares. It is not a measured loss of women through successive promotions. The smaller group also sits inside the wider senior-grade group, so these observations should not be drawn as a career funnel.
Why representation is not promotion probability
To calculate representation, count women in a defined population and divide by all staff in that same population. To calculate a promotion rate, first define who was eligible, for which process and over what period. Then relate successful candidates to that eligible group. Those denominators answer different questions.
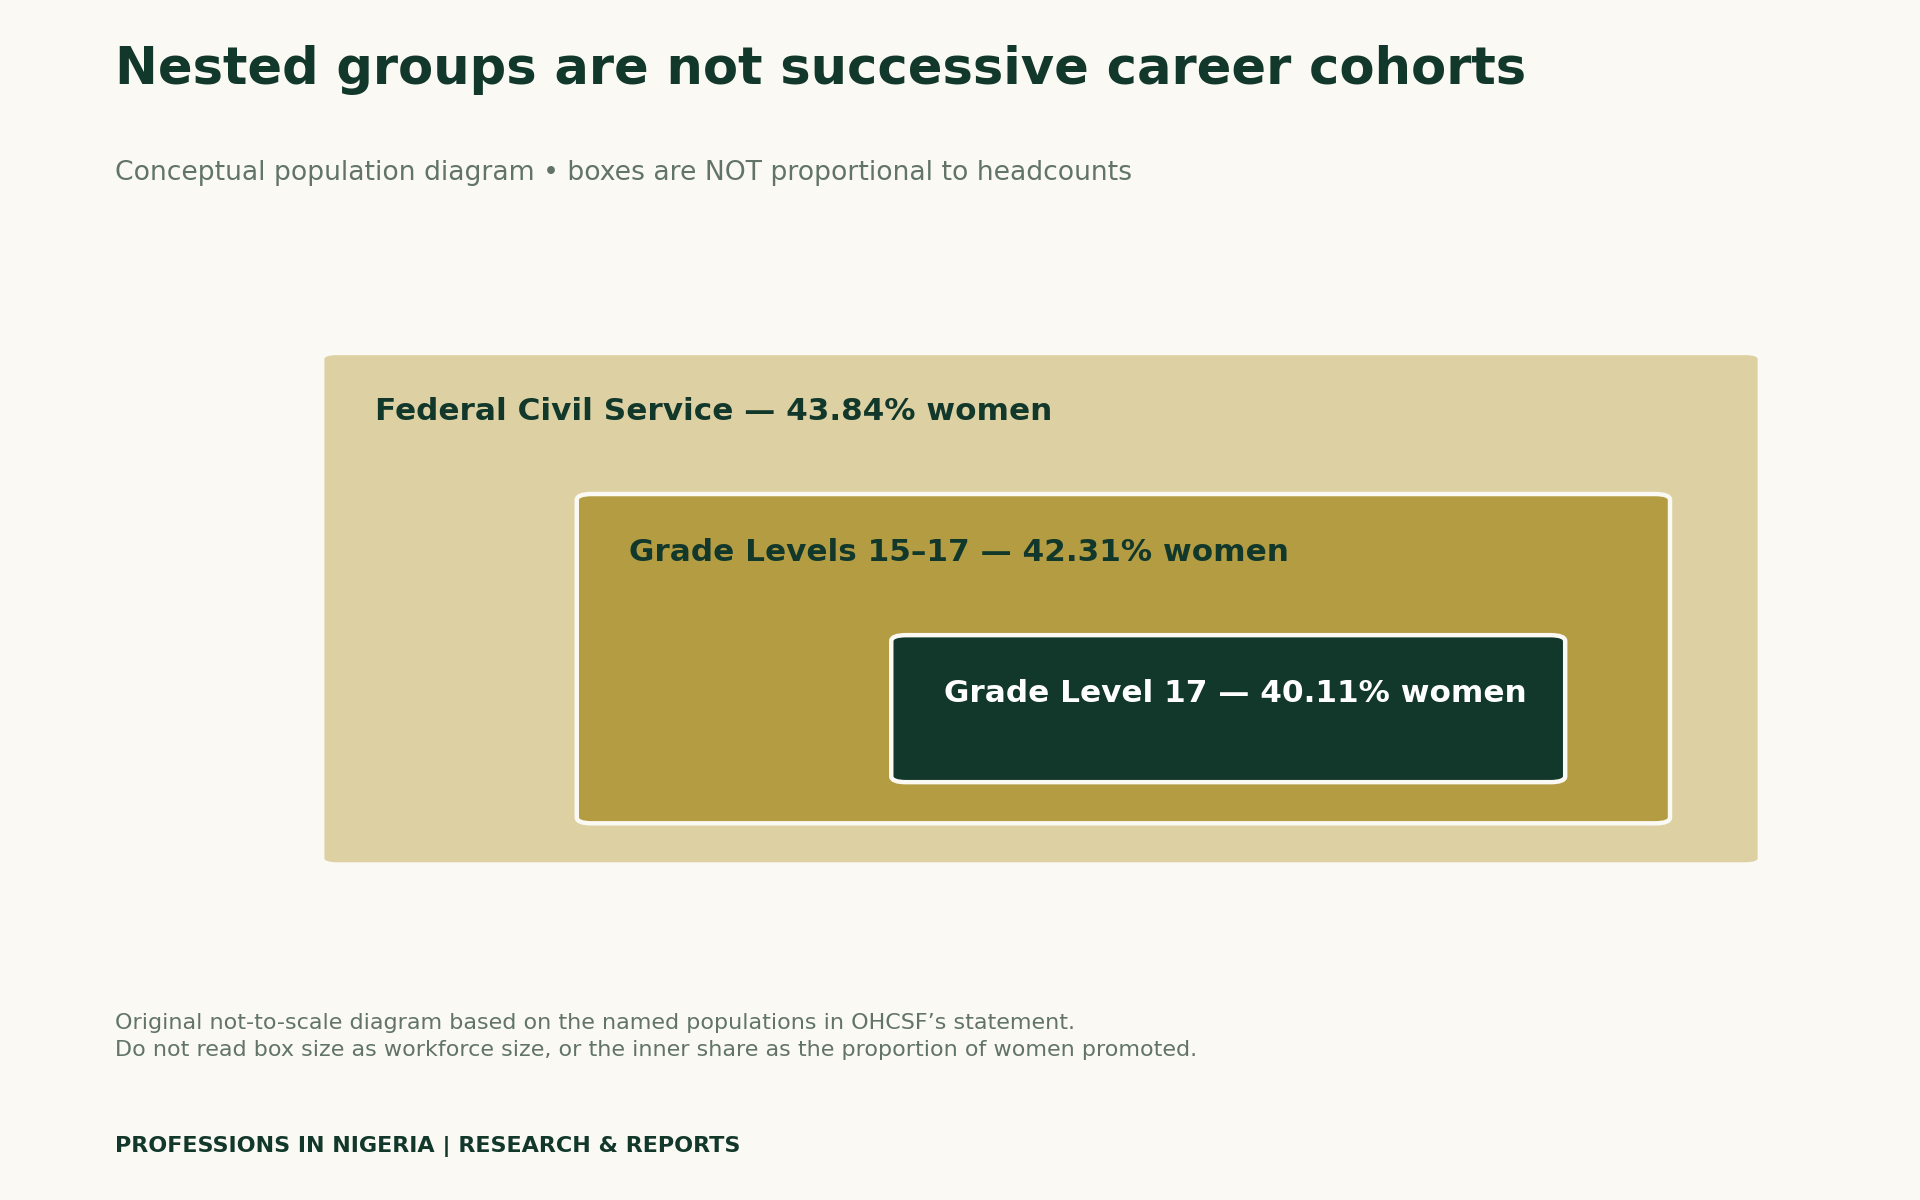
For example, two groups could have similar promotion rates yet different representation at senior levels because their eligible pools differ. Conversely, an overall share could conceal a problem at a particular assessment stage. These are analytical possibilities to investigate. They are not findings about the Federal Civil Service in this announcement.
Avoid the sentence “only 40% of women reach GL17.” It changes the denominator from all officers at that grade to all women in a career cohort. The source does not provide that cohort or follow it over time. A careful summary keeps the named population attached to the percentage and leaves the missing information visible.
Use a monitoring template that names each denominator
Our proposed annual template records scope, grade group, eligible staff, applicants, assessed candidates and successful candidates. It also asks for a time-at-grade definition, source, snapshot date and comparability notes. Keep the rows blank until authorised aggregate records support them. Do not reverse-engineer headcounts from rounded percentages.
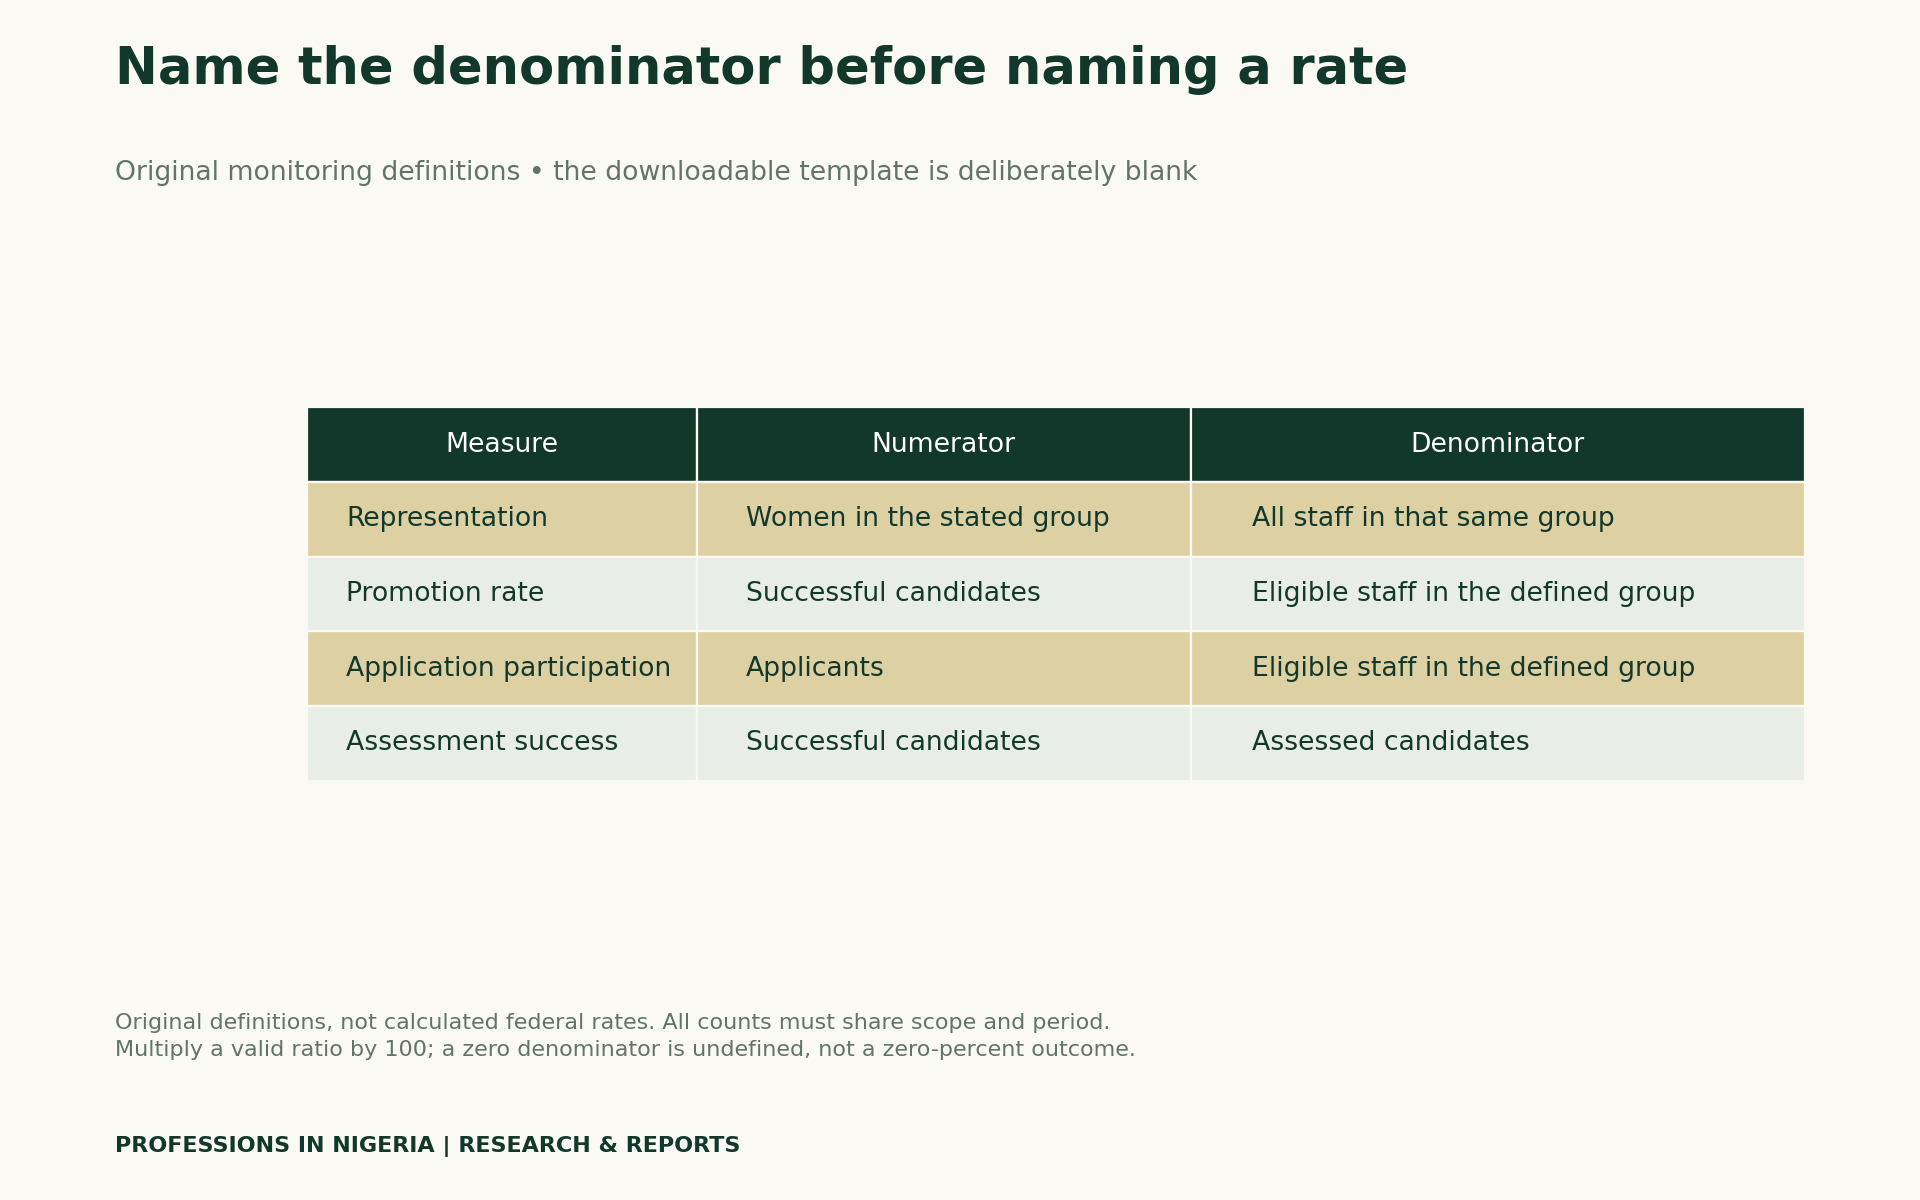
For this template, promotion rate means successful candidates divided by eligible staff in the defined group, multiplied by 100. A separate assessment-success rate uses assessed candidates as its denominator. Report the label and denominator together. If the denominator is zero, the ratio is undefined; do not display it as a zero-percent outcome.
Before comparing years, check whether the definitions changed. A reorganisation, altered eligibility rule, new grade grouping or different observation date can affect comparability. Record those changes before interpreting movement as progress or decline. A source with unresolved gaps should remain provisional rather than being forced into a complete-looking trend chart.

Build a mentoring review around work evidence
A mentoring plan can support a focused conversation without promising promotion. Agree a specific skill goal, identify a suitable assignment opportunity and decide what work evidence can be reviewed. Then record feedback, a next action and a review date. The purpose is to make the learning discussion concrete.
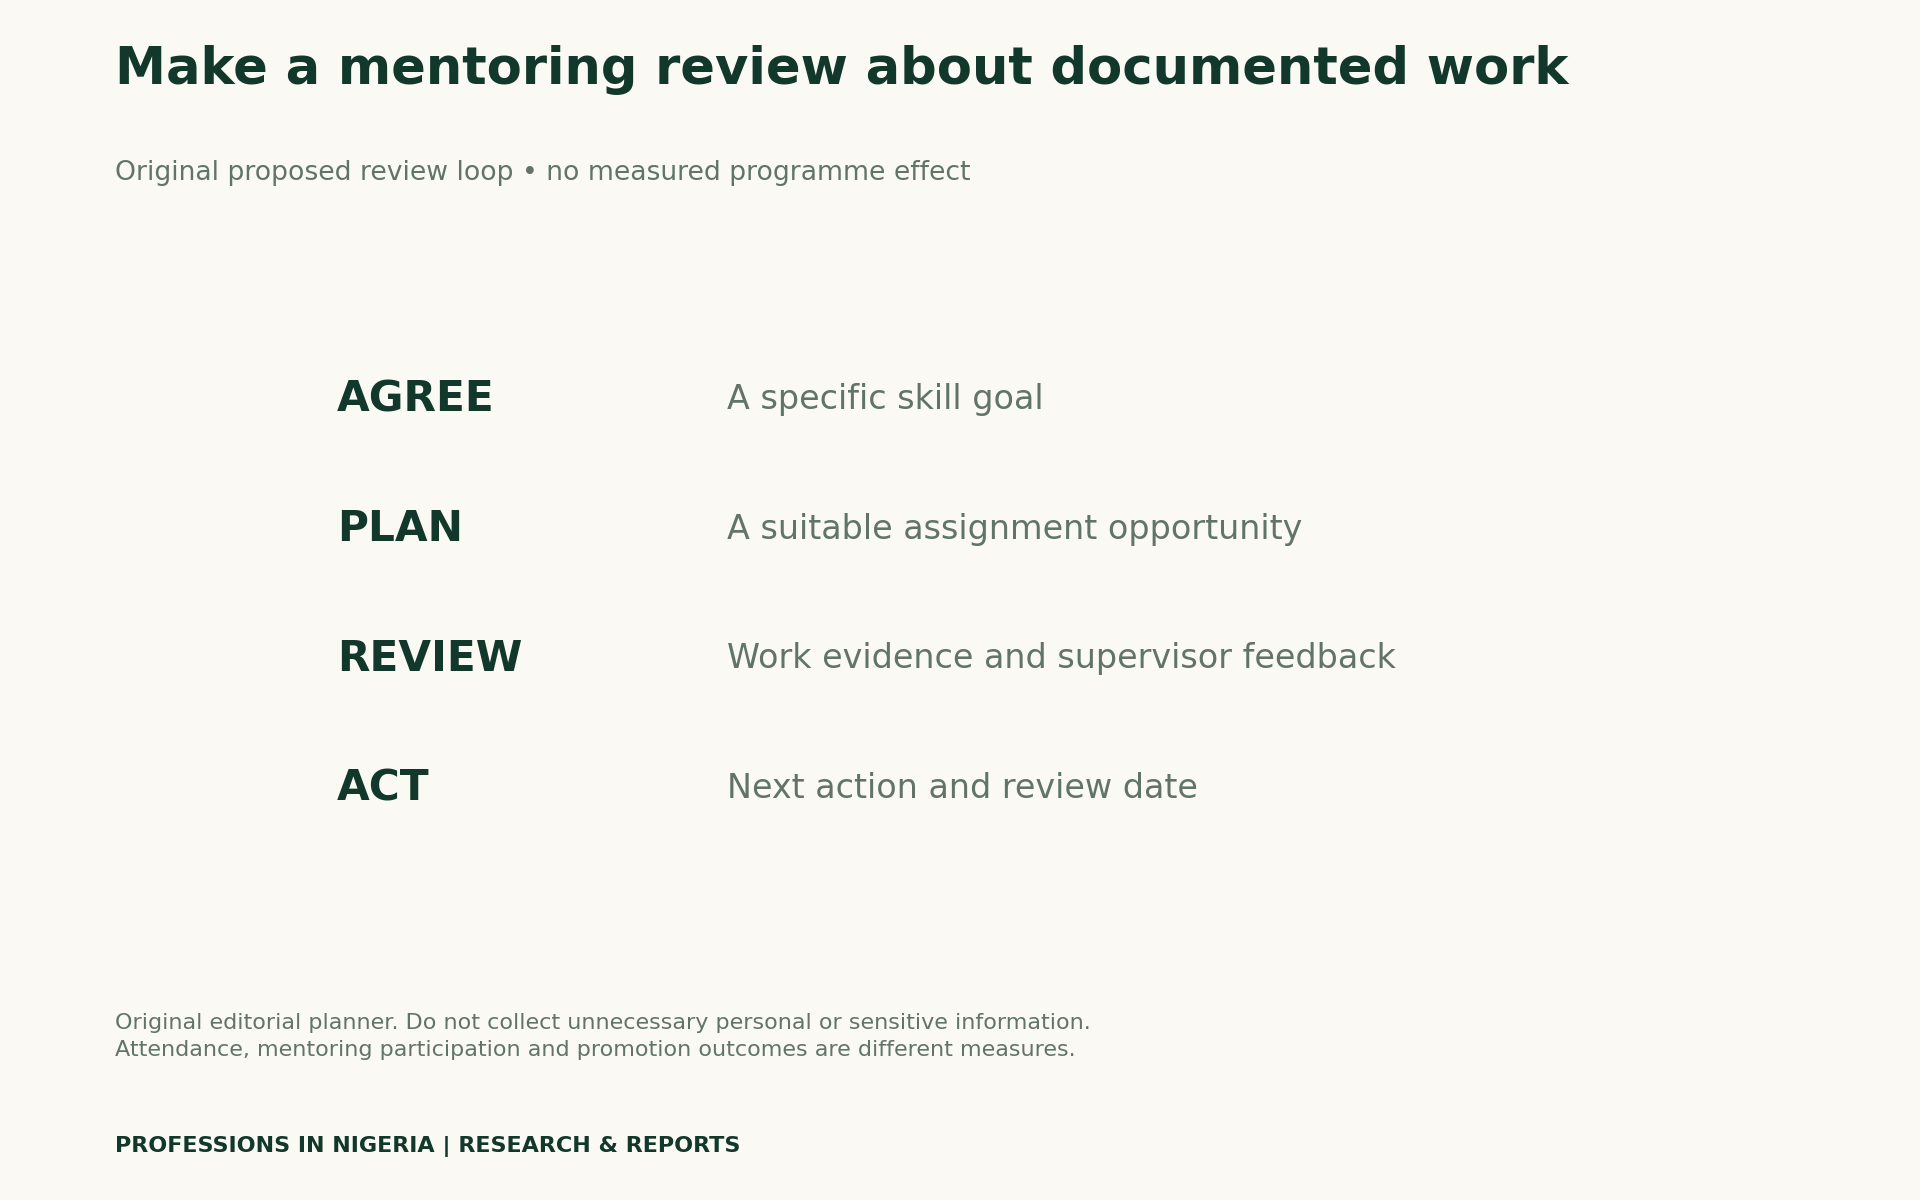
Keep participation, completion and demonstrated work separate in the record. Attending a meeting does not establish that a skill improved, and a stronger work sample does not establish that promotion occurred. If a programme later evaluates outcomes, it needs a defined comparison, suitable data and a method that addresses alternative explanations.
Also, minimise personal information. An aggregate monitoring table does not need names, contact details or private employee narratives. A personal learning record should stay in an appropriate private location and contain only information needed for the agreed purpose. Do not upload confidential staff records to the public worksheet or share them as portfolio evidence.
For a separate example of turning training into traceable work, see our procurement learning evidence pack. The subject differs, but the discipline is similar: name the task, show permitted evidence and distinguish practice from an authorised professional outcome.
What would make a future comparison credible?
To study career progression for women in the civil service in Nigeria, data must follow a defined population over time. Start with a documented workforce date and consistent population definitions. Obtain the relevant aggregate counts, then explain eligibility and time at grade. If promotion outcomes are analysed, define the process, period and successful-candidate measure. Publish enough methodology for another reader to reproduce the calculation without disclosing private employee information.
The announced five-year OHCSF–UN Women partnership expresses a direction for reform. It does not supply a longitudinal dataset or demonstrate an effect on an individual’s advancement. Likewise, these federal figures should not be generalised automatically to state or local services. Each population needs its own scope and evidence.
Download the data and blank review tools
Download the three published representation observations (CSV), percentage-point comparisons (CSV), blank annual progression-monitoring template (CSV), and blank mentoring-review worksheet (CSV). The blank templates contain no inferred workforce counts.
Research checked November 3, 2026. We retained the primary statement, distinguished publication and meeting dates, and checked subtraction with decimal arithmetic. The source does not publish the workforce snapshot date, underlying counts, department breakdown or tenure-adjusted promotion records. Therefore, no promotion rate, causal effect, cohort attrition estimate or probability is calculated here.
Suggested citation: Professions In Nigeria, “Women’s Civil-Service Progression: Read the Representation Figures Correctly,” November 3, 2026. Attribute the preliminary shares to OHCSF’s October 27 statement. Identify the comparison arithmetic and blank monitoring and mentoring tools as original editorial resources.


